
You are here
Lithographs
NASA's Earth Observing System provides a variety of materials available for download. Feel free to choose a category below:
- Brochures
- Postcards
- Posters
- Science Writers’ Guide
- Mission Brochures
- Fact Sheets
- Calendars
- Booklets
- Lithographs
- Reference and Data Products Handbooks
- iBooks
- Activities
 |
Explore Internships, Careers, and Opportunities at NASA Are you ready to explore the extraordinary? Explore Internships, Careers, and Opportunities at NASA. This publication appears in: |
 |
NASA Science Suborbital Platforms NASA Science supports a variety of suborbital platforms that are designed to take science measurements, including aircraft, balloon, kites, and unscrewed aircraft systems. This publication appears in: |
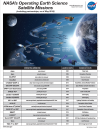 |
NASA's Operating and Future Earth Science Satellite Missions NASA's operating and future Earth science satellite missions as of May 2018. This publication appears in: |
 |
GPM: Global Precipitation Measurement In this lithograph, you will learn about the specifics of the Global Precipitation Measurement mission. GPM is an international partnership co-led by NASA and the Japan Aerospace Exploration Agency (JAXA). This mission centers on the deployment of a GPM Core Observatory and consists of a network, or constellation, of additional satellites that together will provide next-generation global observations of precipitation from space. This is related to the following mission(s): This publication appears in: |
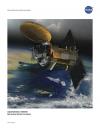 |
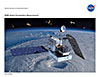
Aquarius SAC-D The Aquarius/SAC-D mission maps salinity at the ocean surface to improve our understanding of Earth’s water cycle and ocean circulation. Changes in Earth’s water cycle lead to increases and decreases in ocean surface salinity, and the variations in salinity influence ocean circulation and climate. Accurate global maps of salinity made with data from Aquarius show scientists long-term changes in this important parameter. This is related to the following mission(s): This publication appears in: |
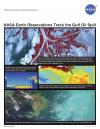 |
NASA Earth Observations Track the Gulf Oil Spill This lithograph discusses how current research projects are making use of NASA’s active and passive remote sensing capabilities to monitor oil spills. One such project is part of the NASA Gulf of Mexico Initiative, which began in response to the impact of Hurricanes Katrina, Dennis, Rita, and Wilma in 2005 and seeks to enhance the ecological and economic health of the Gulf. This publication appears in: |
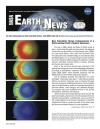 |
NASA Earth News Summary Spring NASA Earth News is a 2-page summary of some of the latest features about Earth science at NASA. 'NASA Earth News' is published quarterly and can be downloaded here in a printable format. This publication appears in: |
 |
NASA Earth News Summary Summer NASA Earth News is a 2-page summary of some of the latest features about Earth science at NASA. ‘NASA Earth News’ is published quarterly and can be downloaded here in a printable format. This publication appears in: |
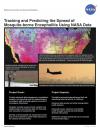 |
Tracking and Predicting the Spread of Mosquito-borne Encephalitis Using NASA Data Mosquitoes obtain encephalitis virus from infected birds and pass it on to humans. This lithograph explains how NASA is working to provide decision makers on the front lines of public health with innovative technologies and satellite data that are tailored into useful tools for combating this deadly disease. This publication appears in: |
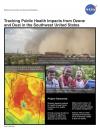 |
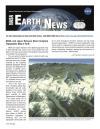
Tracking Public Health Impacts from Ozone and Dust in the Southwest U.S. Many airborne contaminants exacerbate existing health problems, increase health care costs, and reduce a person’s ability to work. The Environmental Public Health Application Systems (ENPHASYS) project bridges individual and community health by forecasting atmospheric ozone, dust, and other aerosols that trigger asthmatic responses or myocardial infarction (MI). This lithograph discusses how NASA satellite data is assimilated into the Community Multiscale Air Quality Modeling System (CMAQ) and Dust REgional Atmospheric Model (DREAM) models to produce ozone, aerosol, and dust forecasts that can be used to generate relevant health-related information. This publication appears in: |