
You are here
Postcards
NASA's Earth Observing System provides a variety of materials available for download. Feel free to choose a category below:
- Brochures
- Postcards
- Posters
- Science Writers’ Guide
- Mission Brochures
- Fact Sheets
- Calendars
- Booklets
- Lithographs
- Reference and Data Products Handbooks
- iBooks
- Activities
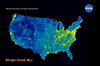 |
Assessing Air Quality from Space Learn about the direct connection between population density in the United States and air pollution in this striking comparison between 3 maps: the 2010 census, U.S. city lights at night, and nitrogen dioxide concentration. This publication appears in: |
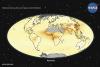 |
Observing Air Quality from Space Compare three major air pollutants, their sources, and how they were distributed across the globe in 2005: nitrogen dioxide, tropospheric ozone, and particulate matter. This publication appears in: |
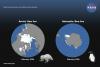 |
Sea Ice This card introduces the subject of the seasonal cycles of sea ice in the Arctic and Antarctic polar climate systems. This publication appears in: |
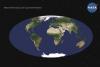 |
Earth by Day, Earth by Night See where urban populations of the developed world are concentrated around the globe. Compare Earth’s daytime map of the continents with a compelling global view of Earth’s city lights at night. This publication appears in: |
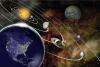 |
NASA's Science Mission Directorate NASA determines Earth’s place in the universe. This publication appears in: |
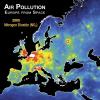 |
Air Pollution: Europe from Space, 2005-2010 (2012) A close-up look at air quality over Europe, 2005-2010, as detected from satellite. See how population and industrialization affects nitrogen dioxide (NO2) levels and how concentrations of this pollutant have changed over time. This publication appears in: |
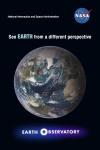 |
Earth Observatory (2011) Find out what NASA’s Earth Observatory has to offer. This publication appears in: |
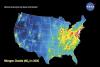 |
NASA AQAST: Serving the Needs of U.S. Air Quality Management (2011) In 2011, NASA’s Applied Sciences Program created the Air Quality Applied Sciences Team, or AQAST, to serve the needs of U.S. air quality management through the use of Earth science satellite data, suborbital data, and models. Satellites are a powerful resource for monitoring changes in air quality. This card shows annual mean satellite observations of tropospheric nitrogen dioxide decrease between 2005 and 2010 as a result of federal and state regulations on emissions. This publication appears in: |
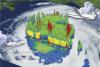 |
NASA Hurricane and Severe Storm Sentinel (2012) Learn how NASA plans to use Unmanned Aircraft Systems (UAS) to study hurricanes and severe storms in the Atlantic Basin. This publication appears in: |
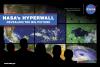 |
NASA's Hyperwall: Revealing the Big Picture (2011) We invite you to explore science at NASA. From the universe, to your backyard, we’ve got something to show you! Wondering what The Big Picture on the front of this card is all about? Find out on the other side. For starters, we’ve chosen a few examples of stories you may have seen on NASA’s Hyperwall. But that’s not all, you’ll also find links that allow you to discover extraordinary examples of our changing planet, and watch fascinating visualizations from NASA’s Scientific Visualization Studio. This publication appears in: |