
Recent Imagery
You will be directed to the NASA Visible Earth webpage when you select Images by Mission below, or click on the images at right that are randomly generated to represent four out of all possible topics.

You are here
Science Communication Material
NASA's Earth Observing System provides a variety of materials available for download. Feel free to choose a category below:
- Brochures
- Postcards
- Posters
- Science Writers’ Guide
- Mission Brochures
- Fact Sheets
- Calendars
- Booklets
- Lithographs
- Reference and Data Products Handbooks
- iBooks
- Activities
 |
NASA Science Resource Brochure This brochure contains a variety of useful links—a great resource for those interested in exploring the many facets of NASA. Have fun exploring! This publication appears in: |
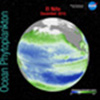 |
Ocean Phytoplankton, El Niño and La Niña This lenticular flip card shows monthly sea surface chlorophyll in the Pacific Ocean as observed during El Niño (December 2015), neutral (December 2013), and La Niña (December 1999) conditions. Due to warmer-than-normal sea surface temperatures, increased stratification, and a decrease in upwelled ocean nutrients, El Niño conditions in 2015 caused the local marine food web to experience loss of its usual food supply. This is related to the following mission(s): This publication appears in: |
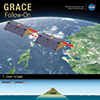 |
Sensing Gravity from Space: GRACE Follow-On The Gravity Recovery And Climate Experiment Follow-On (GRACE-FO) mission will map variations in Earth’s gravitational field. GRACE-FO is a successor to the original GRACE mission, which began orbiting Earth on March 17, 2002. Unlike other missions, the GRACE satellites together form the “instrument”: Two identical spacecraft, orbiting Earth at about 220 km (137 mi) apart, will constantly send signals to each other to measure and track how the distance between them changes as gravity pulls on each satellite. This lenticular card illustrates the movements of the satellites as they pass southward from the Caribbean Sea across Colombia and Peru (i.e., a denser landmass) to the Pacific Ocean. This is related to the following mission(s): This publication appears in: |
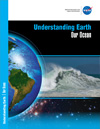 |
Understanding Earth: Our Ocean Viewed from space, Earth appears as a blue marble, as approximately 70% of Earth’s surface is covered by ocean water. The vast ocean holds roughly 97% of the planet’s water and represents 99% of the living space on Earth. NASA has been observing Earth’s ocean from space for more than 38 years, beginning with the launch of the first civilian oceanographic satellite, Seasat, on January 28, 1978. This brochure explains how NASA has the ability to observe and detect changes in the ocean (and on Earth as a whole) on a variety of spatial and temporal scales—ultimately positioning the Agency to improve life on our planet. This is related to the following mission(s):
This publication appears in:
|
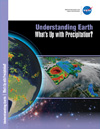 |
Understanding Earth: What's Up with Precipitation? Precipitation is any product of the condensation of atmospheric water vapor that falls quickly from a cloud. The main forms of precipitation include drizzle, rain, sleet, snow, grapple (soft hail or snow pellets), and hail. Today, scientists can measure precipitation directly—using ground-based instruments such as rain gauges—or indirectly—using remote sensing techniques (e.g., from radar systems, aircraft, and Earth-observing satellites). This brochure describes how satellite observations—often combined with other measurements taken on the ground or from aircraft—provide frequent estimates of precipitation at a global scale. Among other uses, precipitation datasets from NASA are used for forecasting tropical cyclones; monitoring soil moisture conditions and freshwater availability; and predicting flood and drought conditions, landslides, crop yields, and water-related illnesses. This is related to the following mission(s): This publication appears in: |
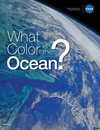 |
What Color is the Ocean? Activity In this activity, you will use a simple spectrophotometer to test how light at different visible wavelengths (blue, green, red) is transmitted, or absorbed, through four different colored water samples. This is related to the following mission(s): This publication appears in: |
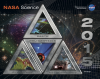 |
2015 NASA Science Mission Directorate Calendar |
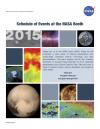 |
2015 Schedule of Events at the AGU NASA Booth |
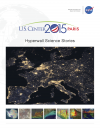 |
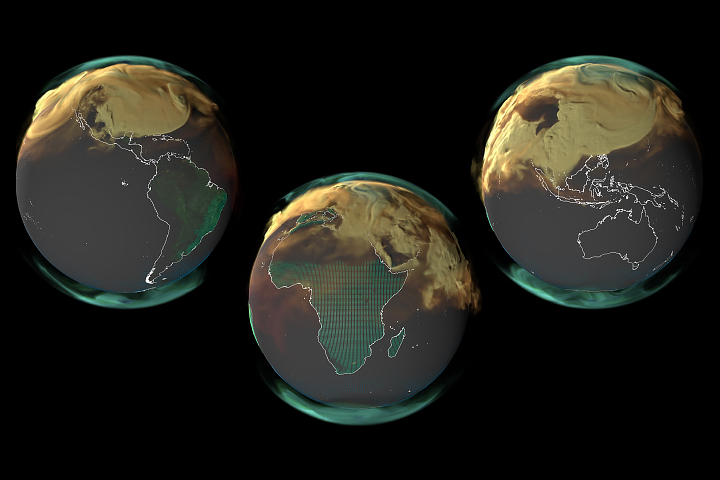
COP-21 Hyperwall Science Stories The twenty-first Conference of Parties (COP-21) to the United Nations Framework Convention on Climate Change will take place in Paris, France, November 30 to December 11, 2016. This brochure contains most of the science stories that will be shown on the Hyperwall at COP-21 grouped by theme. This publication appears in: |
 |
GLOBE Program Bookmark The Global Learning and Observations to Benefit the Environment (GLOBE) Program connects students, teachers, scientists, and other citizens to learn about the Earth environment and climate through data collection, analysis, and research. These data are entered into an international scientific database via website or with apps, and shared for analysis and research by students and scientists from over 100 countries around the world. This publication appears in: |