
You are here
Science Communication Material
NASA's Earth Observing System provides a variety of materials available for download. Feel free to choose a category below:
- Brochures
- Postcards
- Posters
- Science Writers’ Guide
- Mission Brochures
- Fact Sheets
- Calendars
- Booklets
- Lithographs
- Reference and Data Products Handbooks
- iBooks
- Activities
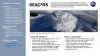 |
Seadler - SEAC4RS Results Slide The Studies of Emissions and Atmospheric Composition, Clouds, and Climate Coupling by Regional Surveys (SEAC4RS) campaign studied how aerosols are injected into and influence upper tropospheric (UT) and lower stratospheric (LS) composition and chemistry. This publication appears in: |
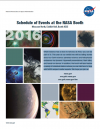 |
2016 NASA Booth Program for AGU NASA Science has a story to tell and, at AGU, you can be part of it. This year at our exhibit we will be telling stories about our Earth science, planetary science, and heliophysics endeavors via dynamic Hyperwall presentations, flash talks, and hands-on demos. In addition, the booth will also feature a variety of individual stations where you can talk face-to-face with NASA subject-matter experts. We hope you join us! This publication appears in: |
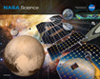 |
2016 NASA Science Mission Directorate Calendar |
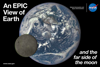 |
An EPIC View of Earth and the Far Side of the Moon On July 16, 2015, a NASA camera onboard the Deep Space Climate Observatory (DSCOVR) satellite returned a series of images of the entire sunlit side of Earth and the moon from its orbit at the first Lagrange point (L1)—a neutral gravity point between Earth and the sun, which is about 1 million miles (1.5 million kilometers) from Earth. These images from the series, taken by the Earth Polychromatic Imaging Camera (EPIC) between 3:50 PM and 8:45 PM EDT, show the fully illuminated far side of the moon moving over the Pacific Ocean near North America. Also referred to as the “dark side,” this side of the moon is not visible from Earth. The far side lacks the large, dark, basaltic plains, or maria, that are so prominent on the Earth-facing side. The largest far side maria is the Mare Moscoviense [~170 miles (245 kilometers) in diameter] in the upper left quadrant. As the DSCOVR spacecraft slowly orbits around L1 (always viewing the sunlit side of Earth), the area of reflected sunlight near the center of the globe remains stationary, while the moon crosses the face of the Earth’s surface and Earth appears to rotate from left (west) to right (east). The North Pole is in the upper left quadrant of the globe. The primary objective of DSCOVR—a partnership between NASA, the National Oceanic and Atmospheric Administration (NOAA), and the U.S. Air Force—is to maintain the nation’s real-time solar wind monitoring capabilities, which are critical to the accuracy and lead time of space weather alerts and forecasts from NOAA. This is related to the following mission(s): This publication appears in: |
|
|
Astrophysics Discover how the universe works, explore how it began and evolved, and search for life on planets around other stars. This publication appears in: |
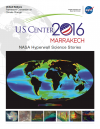 |
COP-22 Hyperwall Content This brochure provides information about the content displayed on NASA's Hyperwall in the U.S. Center at the twenty-second session of the Conference of the Parties (COP-20) held November 7-18, 2016, in Marrakech, Morocco. This publication appears in: |
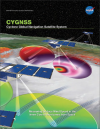 |
CYGNSS Mission Brochure This brochure provides an overview of NASA's Cyclone Global Navigation Satellite System (CYGNSS) mission--NASA’s first satellite mission to measure surface winds in the inner core of tropical cyclones, including regions beneath the eyewall and intense inner rainbands that could not previously be measured from space. These measurements will help scientists obtain a better understanding of what causes variations in tropical cyclone intensity, helping to improve our ability to forecast tropical cyclones such as Hurricane Katrina. This is related to the following mission(s): This publication appears in: |
|
|
Earth System Ruler Like the human body, Earth comprises diverse processes and systems that interact with one another in complex ways. The purpose of NASA’s Earth science program is to advance our scientific understanding of Earth as an integrated system and its response to natural and human-induced changes. NASA works with its domestic and international partners to support a large number of Earth-observing satellite and airborne missions to observe and understand our planet on global and regional scales. These missions are able to collect measurements of surface temperature, winds, water vapor, clouds, precipitation, soil moisture, ocean salinity, and other aspects of the environment. While scientists learn a great deal from studying individual phenomena, improved observational capabilities, coupled with process-level and global numerical models increasingly allow them to study component system interactions, leading to unprecedented insight into how Earth functions as one integrated system of systems. This publication appears in: |
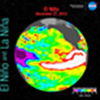 |
El Niño and La Niña This lenticular flip card shows El Niño (December 27, 2015), neutral (January 15, 2014), and La Niña (November 15, 1999) sea surface heights relative to a reference state established in 1992. In the equatorial region of the Pacific Ocean, the sea surface height during El Niño was higher by more than 18 cm over a large longitudinal region. This is related to the following mission(s): This publication appears in: |
 |
NASA Science Program Support Office Annual Report 2016 The Science Program Support Office (SPSO) supported 25 domestic and international science conferences and public events in FY2016. The SPSO strives to provide an inspiring and interactive venue for every event during the year, using a unique storytelling approach that allows a variety of audiences worldwide to connect with NASA Science. The 2016 Annual Report provides a broad overview of these activities, along with details about new Hyperwall stories, publications, social media, key partnerships, and more! This publication appears in: |