
You are here
Science Communication Material
NASA's Earth Observing System provides a variety of materials available for download. Feel free to choose a category below:
- Brochures
- Postcards
- Posters
- Science Writers’ Guide
- Mission Brochures
- Fact Sheets
- Calendars
- Booklets
- Lithographs
- Reference and Data Products Handbooks
- iBooks
- Activities
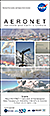 |
AERONET (2012) This resource gives a brief overview of the AErosol RObotic NETwork (AERONET) program, which provides a long-term, accessible database of aerosol properties. Long-term commitment to AERONET sites worldwide provides assessment of the regional climatological impact of aerosols (e.g., aerosol amount, size, and heating or cooling effects). Learn more about this international program and how measurements from AERONET help improve our understanding of Earth’s climate. This publication appears in: |
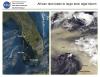 |
African Dust Leads to Large Toxic Algal Bloom (2001) Each year, several hundred million tons of African dust are transported westward over the Atlantic to the Caribbean, Gulf of Mexico, Central America, and South America. Thunderstorms and accompanying warm air can lift dust as high as 4575 meters (15,000 feet) above the African deserts, and then out across the Atlantic. This publication appears in: |
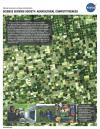 |
Agricultural Competitiveness (2003) One of our nations most vital needs is a stable and dependable food supply for an ever-increasing population. The Midwest United States is known as America’s Breadbasket because it is home to the vast majority of America’s productive farmland and is a vital cog in the American economy. Any disruption to the productivity of these lands can have devastating economic consequences. For example, in the summer of 1988, the Midwest United States experienced its worst dry spell since the 1930s causing an estimated $40 billion in crop damages. In contrast, summer 1993 was exceptionally wet, with flooding on the Missouri and Mississippi rivers that wreaked havoc on agricultural lands and caused extensive crop damage. This publication appears in: |
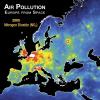 |
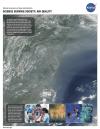
Air Pollution: Europe from Space, 2005-2010 (2012) A close-up look at air quality over Europe, 2005-2010, as detected from satellite. See how population and industrialization affects nitrogen dioxide (NO2) levels and how concentrations of this pollutant have changed over time. This publication appears in: |
 |
Air Quality (2003) The Clean Air Act, created in 1972 and last amended in 1990, responds to the basic societal need for clean, breathable air and recognizes the need to protect this vital natural resource. Congress directed the Environmental Protection Agency (EPA) to set National Ambient Air Quality Standards (NAAQS) for pollutants considered harmful to public health and the environment. Although these regulations have significantly improved the quality of our nation’s air over the past 30 years, people in some areas are still exposed to air pollution levels that exceed the NAAQS. Numerous studies have shown significant effects of air pollution on human health, agriculture, ecosystems, and physical infrastructure. This publication appears in: |
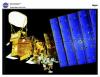 |
Aqua (2001) The Aqua mission, launched in May 2002, builds on NASA’s long history of studying the Earth and its atmosphere from the impressive perspective of space. Amongst the aims are an integrated understanding of the Earth system at present, an improved understanding of the prominent changes the system has undergone in the past, and improved predictions regarding how the system is likely to change in the future. This is related to the following mission(s): This publication appears in: |
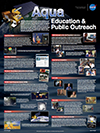 |
Aqua Education & Public Outreach (2011) This poster highlights the education and public outreach activities of the Aqua satellite mission. It features examples that highlight how Aqua data are used, as well as the efforts of the Aqua team to distribute this information and demonstrate its applications. This is related to the following mission(s): This publication appears in: |
 |
ASTER (2001) The ASTER instrument measures cloud properties, vegetation index, surface mineralogy, soil properties, surface temperature, and surface topography for selected regions of the Earth. This is related to the following mission(s): This publication appears in: |
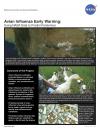 |
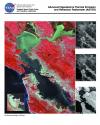
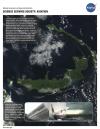
Avian Influenza Early Warning: Using NASA Data to Predict Pandemics (2010) Avian Influenza (AI) is an infection caused by avian influenza viruses. This lithograph explains how NASA data, models, and analysis techniques are used to enhance the decision capabilities concerning (AI) and pandemic influenza risks. This publication appears in: |
 |
Aviation (2006) To compete in the global economy of the 21st Century, the United States requires a safe and efficient aviation infrastructure. Developing this infrastructure will require improvements to the safety, security, and capacity of the National Airspace System (NAS), as well as reductions in the environmental effects of aviation—such as noise and air pollution. Likewise, research has shown that the impact of the environment upon aviation—such as severe weather and other natural phenomena—could be substantially mitigated if existing satellite observations could be more fully utilized. This publication appears in: |