
You are here
Science Communication Material
NASA's Earth Observing System provides a variety of materials available for download. Feel free to choose a category below:
- Brochures
- Postcards
- Posters
- Science Writers’ Guide
- Mission Brochures
- Fact Sheets
- Calendars
- Booklets
- Lithographs
- Reference and Data Products Handbooks
- iBooks
- Activities
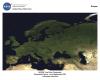 |
MODIS-Europe (2003) This spectacular Moderate Resolution Imaging Spectroradiometer (MODIS) image of Europe is based on the most detailed truecolor image of the entire Earth to date. Using a collection of satellite-based observations, scientists and visualizers stitched together months of observations of the land surface, oceans, sea ice, and clouds into a seamless, true-color mosaic of every square kilometer of our planet. This publication appears in: |
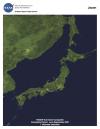 |
MODIS-Japan (2003) This spectacular Moderate Resolution Imaging Spectroradiometer (MODIS) image of Japan, eastern North and South Korea, northeast China, and southeast Russia is based on the most detailed true-color image of the entire Earth to date. Using a collection of satellite-based observations, scientists and visualizers stitched together months of observations of the land surface, oceans, sea ice, and clouds into a seamless, true-color mosaic of every square kilometer of our planet. This publication appears in: |
 |
NASA Applied Sciences Program (2011) The NASA Applied Sciences Program promotes and funds activities that discover and demonstrate innovative uses and practical benefits of NASA’s Earth science resources. By partnering with public and private organizations to apply NASA scientific findings and Earth observing data to decision-making activities, the Applied Sciences Program actively benefits society through Earth science. This publication appears in: |
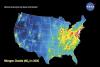 |
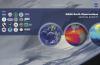
NASA AQAST: Serving the Needs of U.S. Air Quality Management (2011) In 2011, NASA’s Applied Sciences Program created the Air Quality Applied Sciences Team, or AQAST, to serve the needs of U.S. air quality management through the use of Earth science satellite data, suborbital data, and models. Satellites are a powerful resource for monitoring changes in air quality. This card shows annual mean satellite observations of tropospheric nitrogen dioxide decrease between 2005 and 2010 as a result of federal and state regulations on emissions. This publication appears in: |
 |
NASA Earth Observations Serving Society (2007) This brochure offers an overview of the NASA Earth Science Applications, which benchmark practical uses of NASA-sponsored observations from Earth observation systems and predictions from Earth science models. NASA implements projects that carry forth this mission through partnerships with public, private, and academic organizations. These partnerships focus on innovative approaches for using Earth science information to provide decision support that can be adapted in applications worldwide. This publication appears in: |
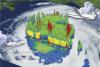 |
NASA Hurricane and Severe Storm Sentinel (2012) Learn how NASA plans to use Unmanned Aircraft Systems (UAS) to study hurricanes and severe storms in the Atlantic Basin. This publication appears in: |
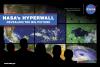 |
NASA's Hyperwall: Revealing the Big Picture (2011) We invite you to explore science at NASA. From the universe, to your backyard, we’ve got something to show you! Wondering what The Big Picture on the front of this card is all about? Find out on the other side. For starters, we’ve chosen a few examples of stories you may have seen on NASA’s Hyperwall. But that’s not all, you’ll also find links that allow you to discover extraordinary examples of our changing planet, and watch fascinating visualizations from NASA’s Scientific Visualization Studio. This publication appears in: |
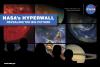 |
NASA's Hyperwall: Revealing the Big Picture (2011) We invite you to explore science at NASA. From the universe, to your backyard, we’ve got something to show you! Wondering what The Big Picture on the front of these two cards is all about? Find out on the other side. For starters, we’ve chosen a few examples of stories you may have seen on NASA’s Hyperwall. But that’s not all, you’ll also find links that allow you to discover extraordinary examples of our changing planet, and watch fascinating visualizations from NASA’s Scientific Visualization Studio. This publication appears in: |
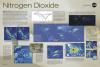 |
Nitrogen Dioxide (2011) Learn about this toxic gas and about some of its primary sources. Did you know that most of the sources of nitrogen dioxide are human-made? Find out how, here! This publication appears in: |
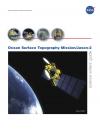 |
Ocean Surface Topography Mission/Jason-2 (2008) The Ocean Surface Topography Mission (OSTM)/Jason-2 advances our understanding of ocean circulation and will improve our ability to forecast climate events and measure global sea-level change. The instruments on board are designed to map ocean surface topography to provide information on ocean wave heights, sea surface topography, tides, and water vapor. OSTM/Jason-2 continues the tasks of the Jason-1 mission. This publication appears in: |